How to analyze your RowShare data?
Once you have gathered data from all your remote users, you're not always done. You now need to understand it to make informed decisions. You might also want to track progress while your data is bein…

Once you have gathered data from all your remote users, you're not always done. You now need to understand it to make informed decisions. You might also want to track progress while your data is being entered.
RowShare analyzes your data the way you want without requiring any technical expertise. You want to analyze your by team? by geography? by status? by owner? Head to the appropriate column, click on the column menu, then "Analyze by xxx", and voilà! It couldn't be easier.
For each group of rows, you can see the numerical values aggregated. You can get a sum, average, max, min, first, last... of each group.
In the following example, we have a Sales forecast that we'd like to have analyzed by Sales Team. Head to the Team column menu, click on "Analyze by Team", and that's it:
That way, all metrics are calculated by group of rows (here target, forecast, attainment...). It's also very easy to only show the groups you want to focus on.
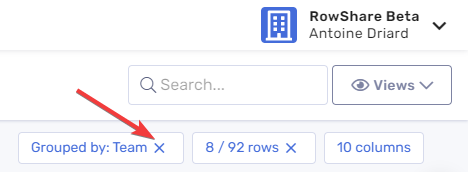
To undo the Analysis and restore the initial table, you can either click on the same column menu, then "Stop analysis", or click on the cross next to the group information, just above the table, on your right:
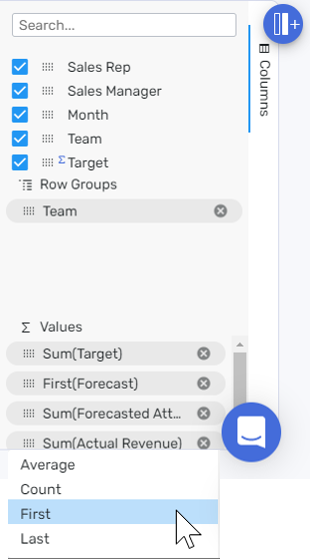
If you want more control, more options, open the Columns Panel at the right of the table to:
- Hide and show columns
- Analyze by columns
- Select the aggregate for each numerical value: sum, average, max, min, count, first, last
How did we do?
How do RowShare charts work?
How do I connect RowShare to Microsoft Power BI, Qlik, Tableau and others?